
State of Last-Mile Disruption 2026
How everyday delivery disruptions turn into missed promises, SLA exposure, and margin leakage.
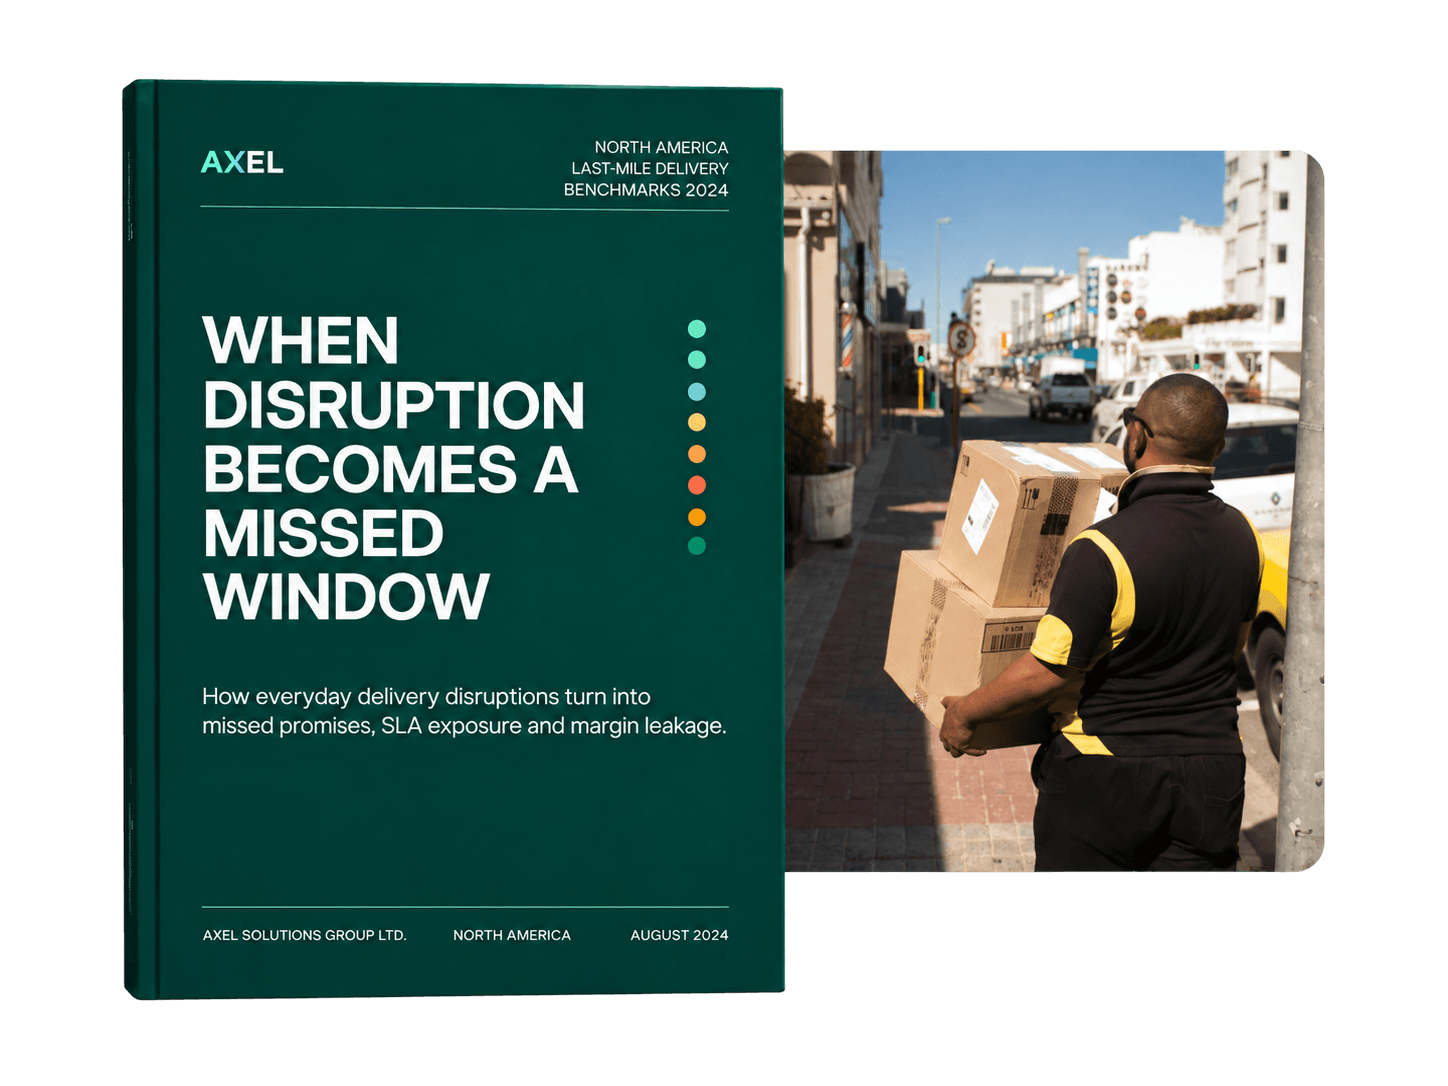
Built from 100 qualified delivery operators.
The benchmark is based on 100 qualified local delivery operators in the Northeast U.S., surveyed in August 2026. Respondents worked across courier, parcel, grocery, medical, pharmacy, perishable delivery, and service-parts operations.
100
Qualified operators
89%
Face 3+ plan-changing disruptions on a typical day
$100
Median reported cost per missed delivery window
$1,125
Median direct exposure per 100 bad-week deliveries
The delivery plan breaks several times every day.
89% of operators said they face at least three disruptions on a typical day that force them to change the plan. More than one in four face six or more.
For most operators, the morning route is only the starting point.
- 0–2: 11%
- 3–5: 62%
- 6–10: 23%
- 10+: 4%
As disruption rises, promised-window performance deteriorates.
The relationship moves in one direction: as daily plan-changing disruption increases, bad-week missed-window rates rise with it.
- 0–2: 5%
- 3–5: 10%
- 6–10: 14%
- 10+: 24%
Every missed promise carries an economic consequence.
Once missed-window frequency starts moving, that cost starts multiplying.
$100
Median reported cost per missed delivery window
$50
Lower quarter
$200
Upper-quarter threshold
16%
Report $500 or more per miss
How much disruption can absorb before service performance begins to deteriorate?
A delivery operation can absorb some change without the customer ever seeing it. The problem starts when too many live decisions compete for attention at once. We call that limit disruption capacity.
Step 1: Incoming disruption
Step 2: Absorbed inside the operation
Step 3: Reaches the customer as a missed window
Under heavy disruption, response time starts to matter much more.
For operators facing six or more disruptions per day.
41%
of operators acting within 15 minutes reported bad-week miss rates above 10%
89%
of operators taking 15 minutes or longer reported bad-week miss rates above 10%
What disruption costs an operation like yours
Based on 100 delivery operations using routing platforms.
Read the full 2026 benchmark
Explore the complete findings, methodology, charts, and operating model behind the benchmark.
What is disruption costing your operation?
The benchmark gives you a reference point. Your own routes, delivery volume, miss rate, and cost per missed window tell you what the problem is worth solving.
See Axel on your operation.
Bring us a real disruption scenario from your operation. We’ll show you how Axel would detect the impact, evaluate the options, and help your team decide what to do next.